Real-Time Plant Status at a Glance
The Short Interval Control (SIC) dashboard gives plant managers a bird's-eye view of critical events, bypasses, and equipment statuses across the entire facility.
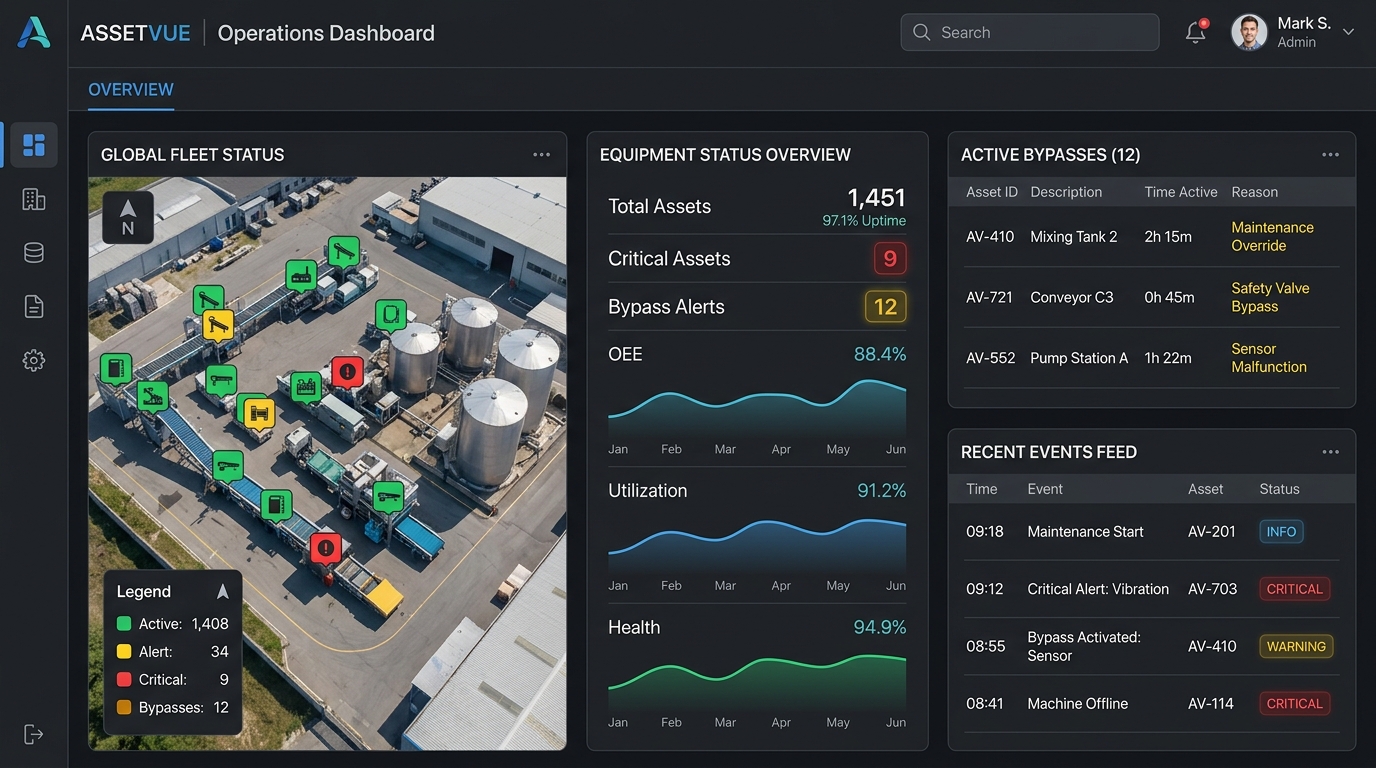
Why You Need SIC Overview Dashboard
The Challenge
- ❌Managers have to read through 10 different logbooks to know plant status
- ❌Critical protection bypasses get buried in daily logs
- ❌No unified view of equipment availability across departments
- ❌Difficult to track follow-up items spanning multiple shifts
The eLogBook Solution
- ✅A single, unified dashboard aggregating critical data from all departments
- ✅Protection bypasses and high-priority events are highlighted automatically
- ✅Equipment status is color-coded and visible in one place
- ✅Follow-up items remain on the dashboard until explicitly closed
How It Works
Configuration
Admins tag specific tables and columns to "Show in Overview".
Operators Log
Operators log data normally during their shifts.
Auto-Aggregation
Dashboard instantly pulls tagged data into unified panels.
Manager Review
Managers filter by time window (e.g., 24h, 7 days) to assess plant health.
Key Capabilities
Dive into the technical details that make this module powerful enough for complex industrial environments.
Cross-Shift Visibility
Break down shift silos. View data spanning multiple shifts or days.
Configurable Time Windows
Quickly toggle between Current Shift, 24h, 48h, 7 Days, or 30 Days.
Status Filtering
Filter rows by status columns to surface only active/critical items.
Color-Coded Badges
Custom status badges make it easy to digest plant state instantly.
Frequently Asked Questions
Common questions about the SIC Overview Dashboard module.
What is a Short Interval Control (SIC) Dashboard?
Can I view data from previous shifts?
How is critical information highlighted?
Do follow-up items get lost after a shift ends?
Can I filter the dashboard view?
Explore Related Modules
Table Configuration
Every plant is different. Use our drag-and-drop engine to build logbook tables that perfectly map to your unique operational processes.
Shift Handover
Ensure incoming operators are fully aware of the plant status with structured, accountable digital handovers backed by PIN security.
Book a Demo to See
SIC Overview Dashboard in Action
Discover how eLogBook integrates seamlessly into your plant's daily operations.
Request a Free Demo