Spot Trends Before They Become Incidents
Turn your shift data into actionable intelligence. Visualize trends, monitor thresholds, and analyze cross-shift performance instantly.
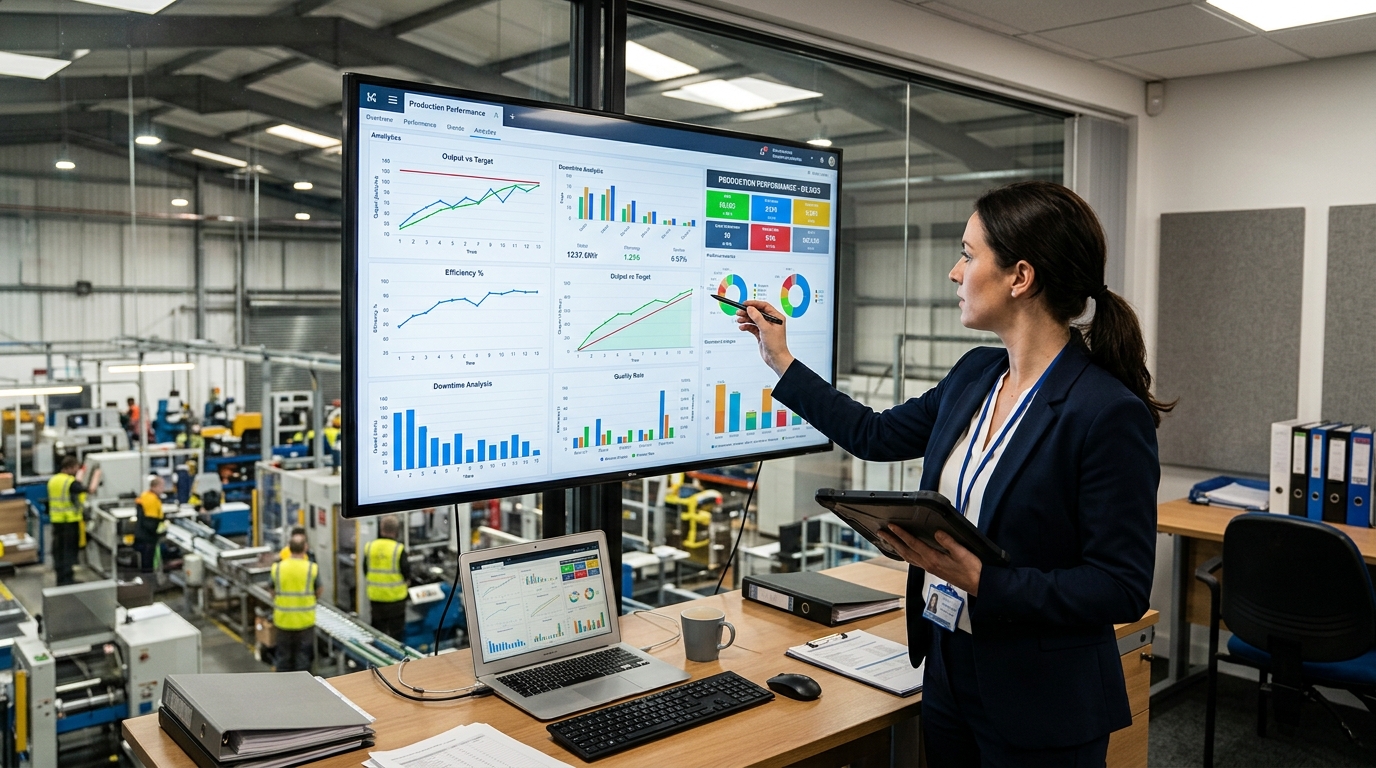
Why You Need Analytics & Trends
The Challenge
- ❌Data is trapped in paper logs, making trend analysis impossible
- ❌Compiling weekly performance reports takes days of manual effort
- ❌Gradual parameter degradation goes unnoticed until failure
- ❌Changing table formats breaks historical reporting
The eLogBook Solution
- ✅Interactive, real-time charts generated directly from logbook data
- ✅Instant min/max/avg analysis across any selected date range
- ✅Visual threshold lines show exactly when parameters enter warning zones
- ✅Cross-version tracking ensures analytics work even after tables are redesigned
How It Works
Select Data Source
Choose a specific department, table, and numeric column.
Set Timeframe
Select a custom date range or quick filters like "Last 7 Days".
Visualize
System instantly plots the data points across all shifts in that timeframe.
Analyze
Overlay threshold limits and view aggregated stats (min, max, average).
Key Capabilities
Dive into the technical details that make this module powerful enough for complex industrial environments.
Interactive Charts
Zoom, pan, and hover over data points to see exact shift details.
Threshold Markers
Visual horizontal lines clearly demarcate safe operating zones.
Cross-Version Matching
Intelligently links data from old table layouts to new ones for seamless history.
Export Ready
Download charts as images or export raw filtered data to CSV.
Frequently Asked Questions
Common questions about the Analytics & Trends module.
What kind of analytics can I see?
Can I see when a parameter exceeded safe limits?
What if we change our logbook table format?
Can I export the data for external reporting?
Are analytics real-time?
Explore Related Modules
Shift Logbook
Replace rigid paper logs with dynamic, configurable tables that adapt to your exact operational needs while ensuring complete data integrity.
Auto Reports
Eliminate manual reporting. eLogbook automatically compiles shift data into professional PDFs and dispatches them to stakeholders.
Book a Demo to See
Analytics & Trends in Action
Discover how eLogBook integrates seamlessly into your plant's daily operations.
Request a Free Demo